Exploring Criminal Activity in the Bronx Vs. New York City Overall
Final Project
Project maintained by Jorge-Perez-00 Hosted on GitHub Pages — Theme by mattgraham

Overview
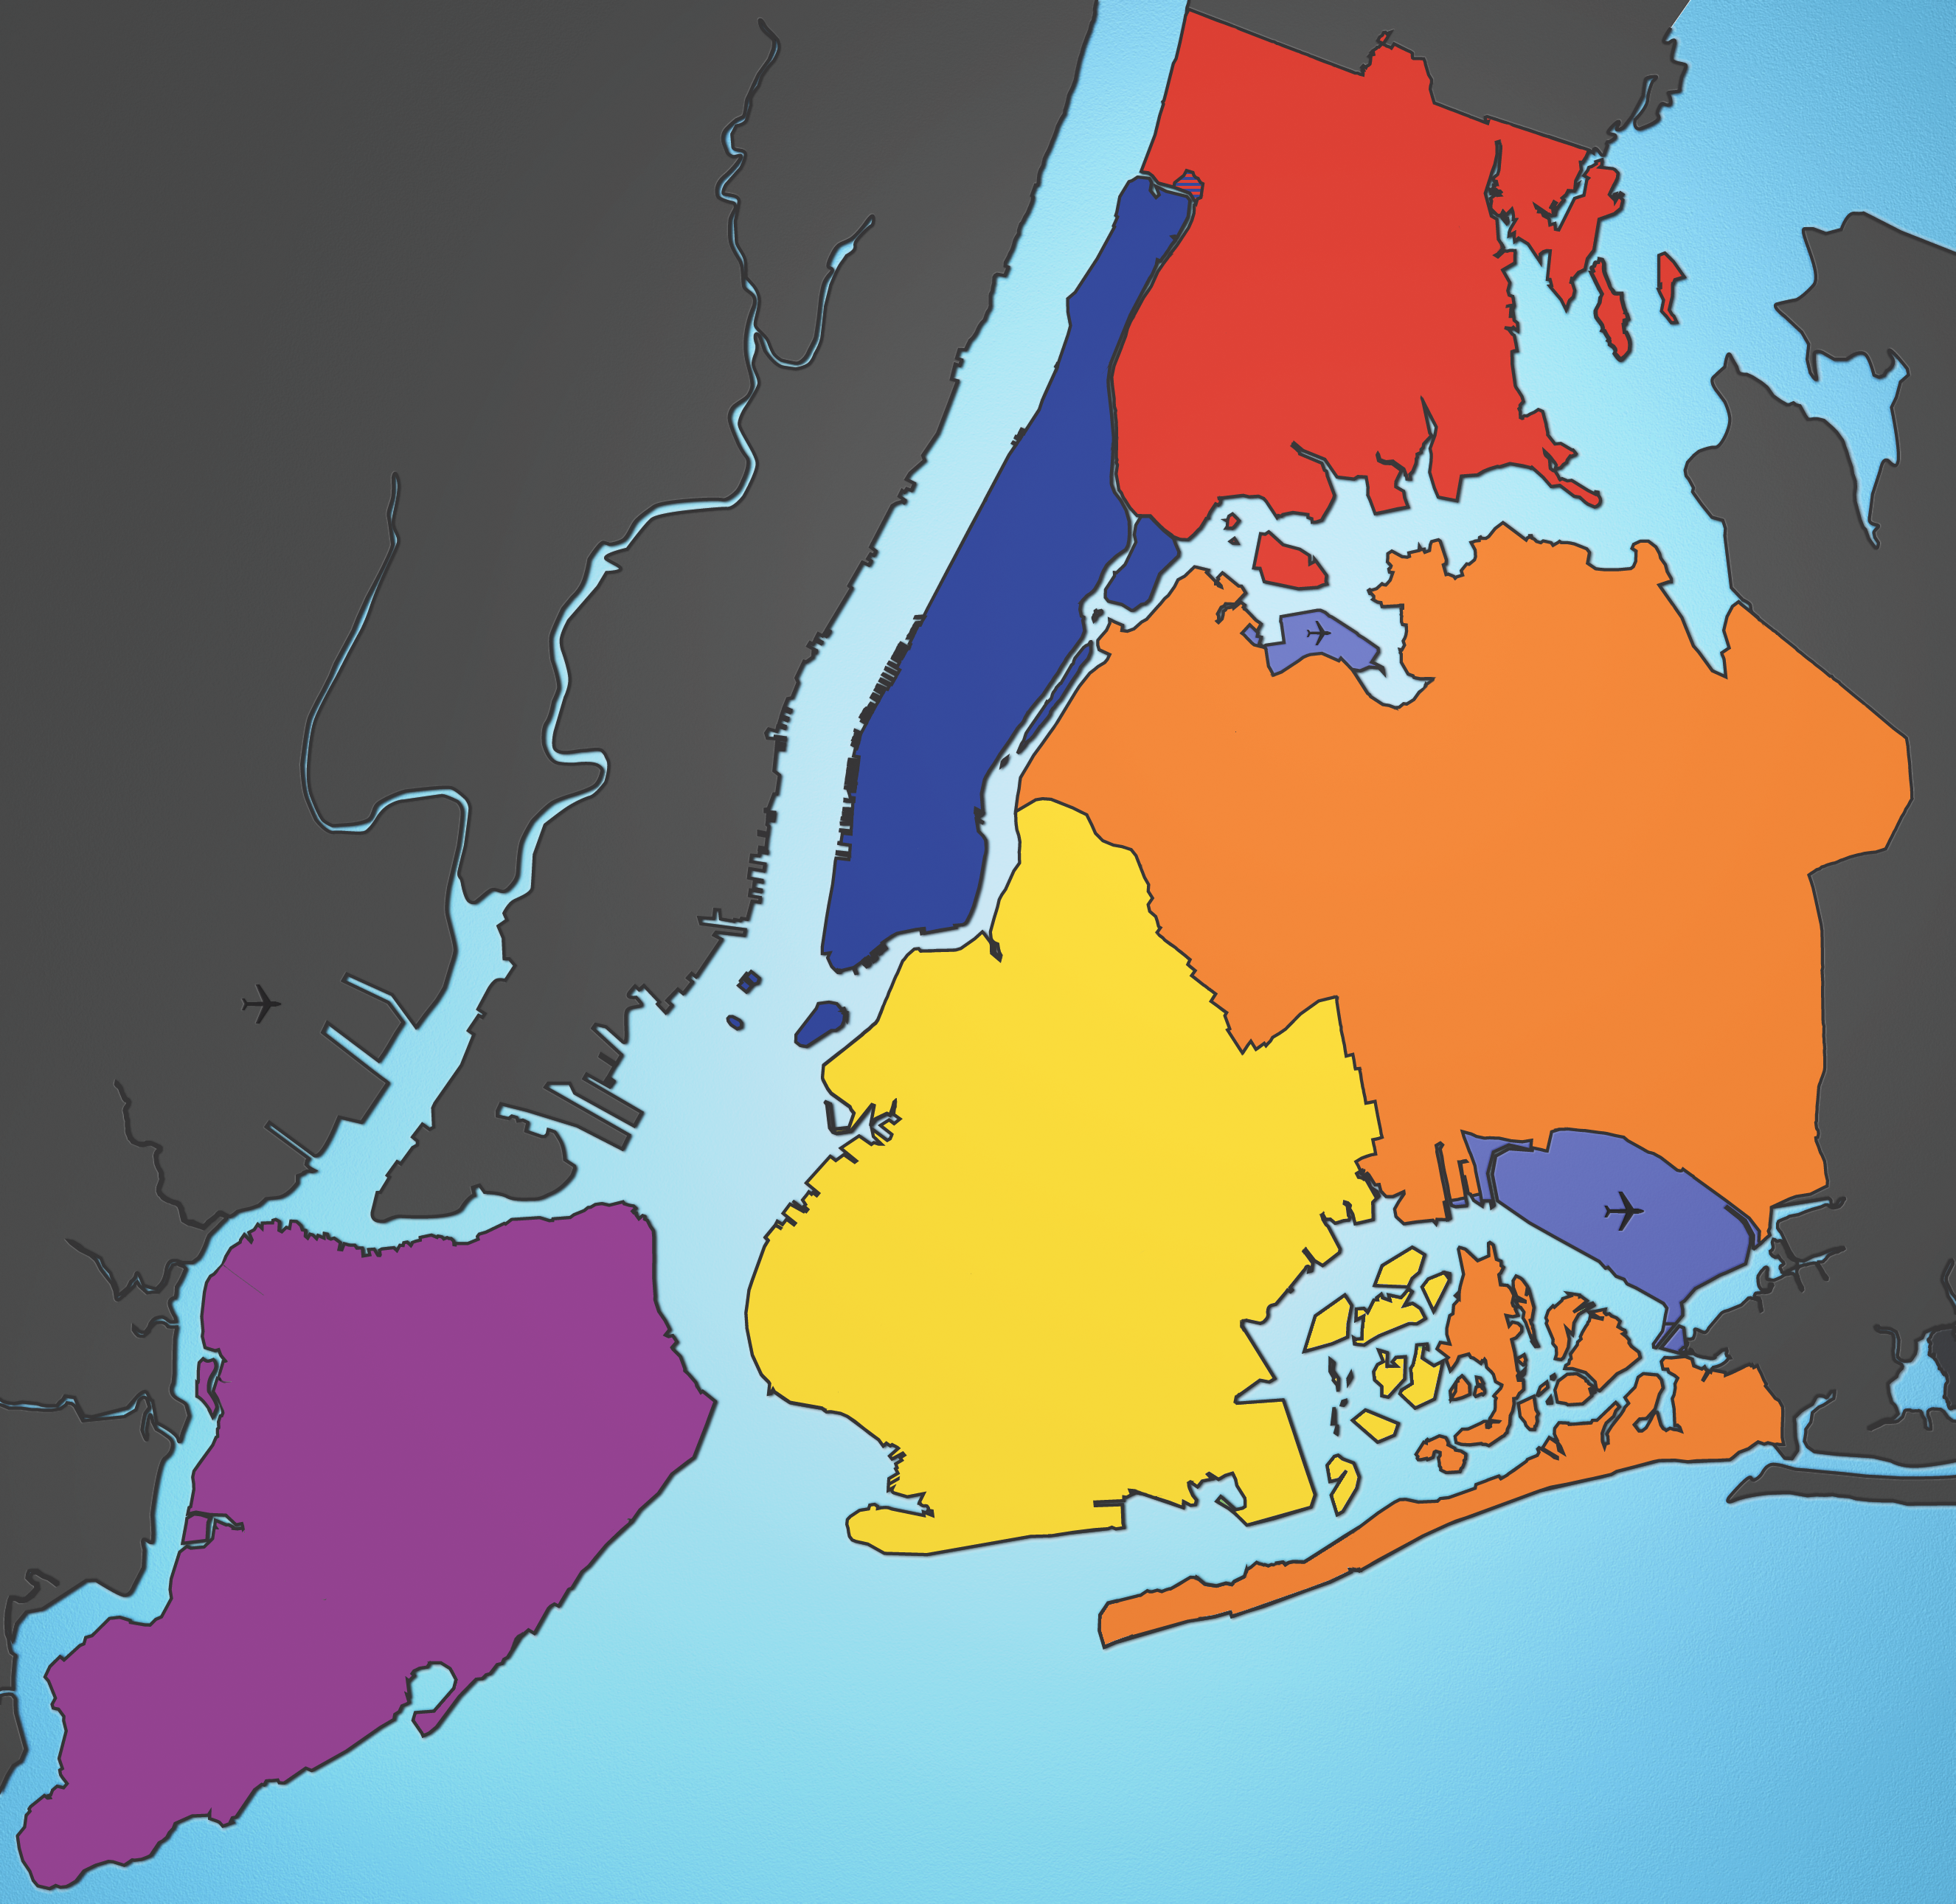
As a long time resident of the Bronx I’ve known that the Bronx was considered a dangerous place for a long time and for that reason I wanted to explore whether or not the Bronx should still be considered one of the top dangerous boroughs of New York City. For this project I used 4 datasets from the official NYC OpenData website and applied data science techniques through the Python programming language and extracted the information and knowledge that accurately showcases the patterns of criminal activity in New York City. The Python tools that I used to explore the datasets were Pandas, Numpy, Matplotlib, and Sklearn.
Data
NYPD Complaints Dataset
The first dataset that I explored was the NYPD Complaints Historic dataset. This dataset contained all valid felony, misdemeanor, and violation crimes reported to the New York City Police Department from 2006 up to 2020 and has been last updated in 2021. The dataset consisted of several columns like both the x and y coordinates of the complaint, the description of the complaint, the exact date occurrence of the complaint, the borough where the complaint took place, and many more. For my project I only used the columns containing the date of occurrence and the boroughs where the complaints took place. With the help of the Python programming language, I extracted both the yearly and monthly complaints reported to NYPD between 2006-2020 and created plots that showcases both the yearly and monthly patterns of complaints in all boroughs of New York City.
.png)
.png)
NYPD Calls for Service
The second dataset that I used to explore the criminal activity patterns of New York City is the NYPD Calls for Service Historic dataset. This dataset contains the millions of calls made to the New York Police Department between 2018-2020. Just like the NYPD complaints dataset, this dataset also contained the location coordinates of each service call, the dates, the boroughs, and much more. For this dataset I also only used the dates and recorded borough of each service call to compute and extract the yearly and monthly service calls between 2018-2020 for all 5 boroughs of New York City.
.png)
.png)
NYPD Arrests Dataset
The third dataset that I used to explore criminal activity in New York City is the NYPD Arrests Historic dataset. This dataset contains all the recorded NYPD arrests made between 2006 up to 2020 and was last updated in 2021. I used both the dates of the arrests and the borough each arrest took place to calculate the yearly and monthly arrests in each borough between 2006-2020.
.png)
.png)
NYPD Shooting Indicents Dataset
The final dataset that I used is the NYPD Shooting Incident historic dataset. This dataset contains all the recorded shooting incidents in New York City between 2006-2020. This dataset only contains shooting incidents that have taken place in the borough of New York City, The other types of information that the dataset provides is the location of the incident, a description of the perpetrator, the arrest id number, the date of occurence, the borough, and much more. Just like the previous datasets, I took both the dates of occurrence and the boroughs where each incident took place and calculated the yearly and monthly shooting incidents for each borough between 2006-2020.
.png)
.png)
Data Processing
I downloaded the csv files for all 4 datasets directly from the NYC OpenData website without filtering out any rows or columns. After downloading the datasets I then converted them to pandas dataframes and filtered the datasets and prepared them for analysis and plotting. The filtering and processing steps consisted of renaming the columns in each dataset that contained the dates of occurrence and the borough each event took place in, converting dates to datetime objects for easy processing, dropping rows that contained no dates or no recorded borough, and filtering out the few columns that I needed of each dataset. After filtering and processing the datasets I then computed the yearly and monthly counts with the use of the functions get_dummies(). groupby() and the sum() function. Before using the groupby() function I first added columns to each dataset that contained the year and month occurrences for each row so that I can group the datasets by year and by both year and month. Finally I used sklearn linear regression model and train_test_split to compute the future yearly predictions up to the year 2025 for each dataset except for the NYPD Calls for Service dataset.
.png)
.png)
.png)
Results/Conclusions
The datasets showed that the Bronx is still one of the dangerous boroughs out of the 5 but it is not the “most” dangerous one. The most dangerous borough out of the 5 boroughs of New York City is Brooklyn. Brooklyn has much higher yearly and monthly counts than the other 4 boroughs in each dataset. When exploring the yearly counts for each dataset, the Bronx is either the second or third borough with the highest counts, but there has been a few times in the monthly counts where the Bronx passed Brooklyn in counts. For example, in the shooting incidents dataset, the Bronx has had a higher count of shooting incidents than Brooklyn many times between 2012 and 2018. Overall, each dataset and the future predictions of each dataset shows that criminal activity has been slowly decreasing and the Bronx borough is following the same decreasing patterns. In the end, I learned that the Bronx borough is not the top dangerous borough of New York City and that Staten Island is the safest borough of New York City.
Citations
- NYPD Complaints Dataset
- NYPD Calls for Service
- NYPD Arrests Dataset
- NYPD Shooting Indicents Dataset
Python Review/Documentation
- Geeksforgeeks
- Pandas documentation
- Stackoverflow